How fast should a website be? Core Web Vitals in plain words
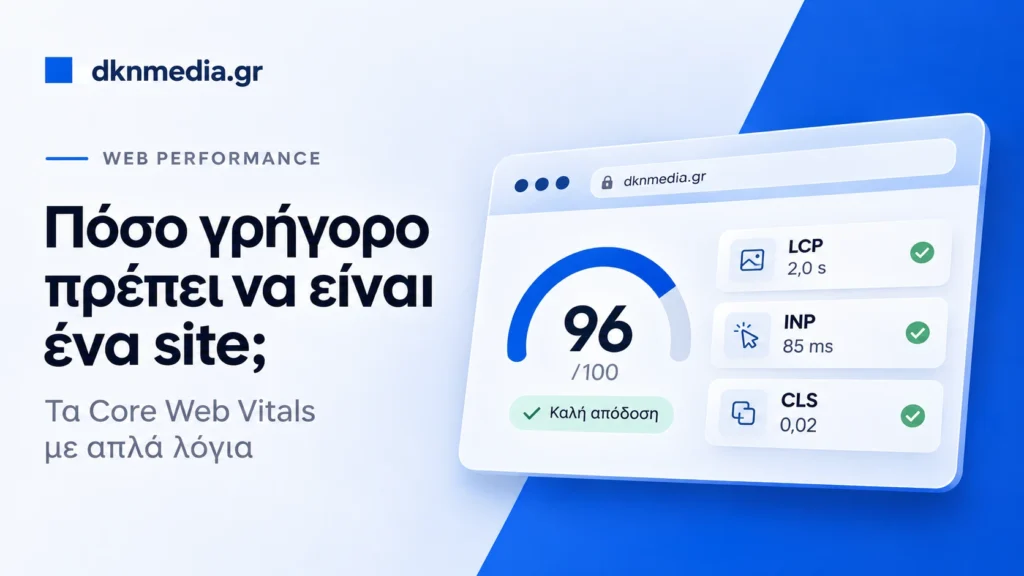
A visitor taps your link on their phone, out on the street, with a so-so signal. If they stare at a white screen for five seconds, they will close the page without ever finding out what you sell. But how fast is “fast enough”? Google has put numbers on it, called Core Web Vitals. Here is what they mean, how to measure them yourself, and what is worth fixing first.
The short answer
A site counts as fast when its main content appears within 2.5 seconds, it responds to taps within 200 milliseconds, and it doesn’t jump around while you read it (CLS of 0.1 or less).
| Metric | What it shows | Good | Needs improvement | Poor |
|---|---|---|---|---|
| LCP | When the main content appeared | up to 2.5 s | 2.5 to 4 s | over 4 s |
| INP | How quickly it responds to taps | up to 200 ms | 200 to 500 ms | over 500 ms |
| CLS | How much the page moves by itself | up to 0.1 | 0.1 to 0.25 | over 0.25 |
One detail makes all the difference: these numbers don’t describe one test from your office. They describe 75% of real visits, separately for phones and computers. More on that below.
What Core Web Vitals are
For years, speed meant the moment a page finished “loading”. But a page can be technically loaded while the visitor still sees nothing, or see everything and be unable to tap anything. So Google settled on three measurements that describe what the person in front of the screen actually experiences:
- Has it loaded? That’s LCP.
- Does it respond when I tap? That’s INP.
- Does it stay put? That’s CLS.
The list changes when something better comes along. INP, for example, replaced the older FID in 2024. So if an old guide talks about FID, you know it no longer applies.
LCP: when the visitor sees what they came for
Largest Contentful Paint measures how long it takes for the largest element on the first screen to appear. That’s usually the main photo or the big headline. It’s the moment the visitor realises they’re in the right place.
What slows it down
LCP time has four parts, and each has a different fix:
- A slow server response: cheap hosting, no cache, lots of plugins running on every visit.
- A late start on the image: the browser finds out late that it needs the photo, or puts it at the back of the queue.
- A heavy image: a 5 MB phone photo uploaded as it is.
- A delay in drawing: the image has arrived, but styles and scripts stop the browser from showing it.
What fixes it
- Shrink your images and upload them as WebP or AVIF, at the dimensions you actually need.
- Don’t lazy-load the main image. Lazy loading is for images further down the page.
- Give it priority, so the browser asks for it among the first things.
- Set up proper caching on the server and, if your visitors come from many countries, a CDN.
- Avoid sliders on the first screen. One well-chosen photo loads faster and usually says more.
INP: does it respond when you tap?
Interaction to Next Paint measures the time from when you tap something until the screen changes. A button that seems dead, a menu that’s slow to open, an “Add to cart” you press twice because nothing happened: all of that is poor INP.
Clicks, taps and key presses count. Plain scrolling doesn’t. The value is usually the worst tap of the whole visit, so a page doesn’t pass just because most of its buttons are quick.
What slows it down
The culprit is almost always JavaScript. A browser does one thing at a time, and while code is running it can’t respond to your finger. On a typical WordPress site or e-shop, that code comes from:
- Off-the-shelf themes and page builders that load everything on every page.
- Plugins that each add their own scripts.
- Outside tools: chat, ad pixels, maps, session recorders.
The problem shows up mostly on mid-range and older phones, because their processors are far slower. You may never see it on a fast computer while your customers live with it every day.
What fixes it
- Take an inventory: which plugins and outside tools do you really use? Whatever you don’t need goes.
- Load the rest only on the pages that need it. A contact form has no reason to load on the home page.
- Give an immediate sign when someone taps, even if the work carries on behind the scenes.
- Split long tasks into shorter ones so the browser can respond in between. That one is for your developer.
CLS: does the page stay where it is?
You’ve been there: you go to tap a button, an image loads above it, everything drops down and you tap something else. That’s what Cumulative Layout Shift measures. It isn’t a time but a score, which is why it has no seconds.
The score combines how much of the screen was affected with how far things moved. An element covering 75% of the screen that moves by 25% of its height scores about 0.19, nearly double the good limit already. Shifts right after your own tap don’t count, because you expect them: a menu that opens when you press it is fine.
What causes it and how to fix it
- Images without dimensions: declare width and height so the browser reserves the space before they arrive.
- Fonts that swap: when the final font is a different size from the temporary one, the text reflows. Pick a temporary font with similar proportions.
- Ads, widgets and embeds: reserve the space they’ll take in advance.
- Content inserted above: offer bars and messages that push the page down. Give them their own space, or lay them over the content without moving it.
Why the 75% changes how you read this
Google doesn’t look at the average or the best result. It looks at the 75th percentile. In plain words: line up all your visits from fastest to slowest and look at the one three quarters of the way along.
If you have 100 visits and your LCP is “good”, at least 75 of them saw the content within 2.5 seconds. That way the hard cases count too: the old phone, the weak signal on the bus. A page passes when it meets all three metrics, so a great LCP won’t rescue a poor CLS.
A 96/100 is not the same as Core Web Vitals
This is where most people get confused. When you open PageSpeed Insights, you see two different things:
- Real-user data (field data): actual Chrome visits over the last 28 days. These are the Core Web Vitals that matter to you.
- A lab test (Lighthouse): a simulation run at that moment, which produces the familiar score from 0 to 100.
The score is useful for finding what’s wrong, but it isn’t the goal. It’s built from five measurements, and one of the heaviest (Total Blocking Time, 30%) isn’t even a Core Web Vital. It also changes from test to test with no change to the site, because the network and the device affect it. 90 and above counts as good, but a 92 and a 97 mean nothing different to your customer.
The reverse happens too: a site scoring 95 in the test can be slow for its real users, because they have weaker phones or are far from the server. When the two disagree, believe the real users.
If your site is small, you probably won’t see any real-user data at all, because Google needs a minimum number of visits to publish it. That’s not a problem. Use the lab test as a guide and, if you can, try the site on a cheap phone on normal 4G.
Does it affect your Google ranking?
Yes, but less than most people think. Google itself recommends good Core Web Vitals for doing well in Search, but it is clear about two things:
- A good result doesn’t guarantee you’ll reach the top.
- The most relevant content wins, even if the page experience isn’t good. A good experience helps mainly when many equally useful pages compete for the same search.
So if someone promises to take you to first place by fixing your speed, be wary. The opposite doesn’t hold either: in a competitive market where everyone has good content, speed can make the difference.
Does it affect your sales?
Here the evidence gets more interesting, because speed doesn’t only bring visitors, it keeps the ones you already have:
- In Deloitte’s Milliseconds Make Millions study, covering 30 million mobile sessions across 37 European brands, a 0.1 second improvement was linked to about 8% more conversions in retail and 10% in travel.
- Vodafone ran an A/B test on a landing page with paid traffic: the version with 31% better LCP brought 8% more sales.
Two notes on reading these. The first study was commissioned by Google, and the companies in both are large. A small shop won’t automatically see the same percentages. What holds is the direction: a quick path to the purchase helps, especially on mobile and especially when you pay for every click. If you run ads, each visitor who leaves before the page loads is money you have already spent.
How to measure your own site in 10 minutes
- Open PageSpeed Insights and enter your address.
- Stay on the Mobile tab. That’s where most businesses get most of their visits, and where problems show.
- Look at the top part first, with the real users. If it says there isn’t enough data, move on to the lab test.
- Test the pages that bring in money, not only the home page: a product, the cart, the contact form.
- If you have Search Console, check the Core Web Vitals report. It groups pages that share the same problem.
- After a change, give it time. User data covers 28 days, so improvement shows gradually.
What to fix first
On most WordPress sites and e-shops we see, this order brings the biggest gain for the least work:
- Images. The easiest and often the most effective: right dimensions, modern format, no delay on the main image.
- Hosting and cache. If the server is slow to respond, everything after it starts late.
- Plugins and outside tools. Every script has a cost. Keep what brings a measurable result.
- Space for everything. Dimensions on images and widgets, so CLS goes away.
- Theme and code. If the site is still slow after all that, the problem is usually the theme or page builder. Then a cleaner build is worth considering.
A common mistake is stacking “speed” plugins on top of a heavy site. They may lift the score, but the best plugin is usually the one you managed to remove.
How fast is fast enough
The goal is green on all three metrics, on mobile, for the pages that bring in business. Once you get there, chasing 100/100 is rarely worth the money. A persuasive text and a clean checkout will do more for you than a few milliseconds.
If you have red on any metric, though, it’s worth looking at now, especially if you pay for ads. If you don’t know where to start, send us your site and we’ll tell you what we would fix first.